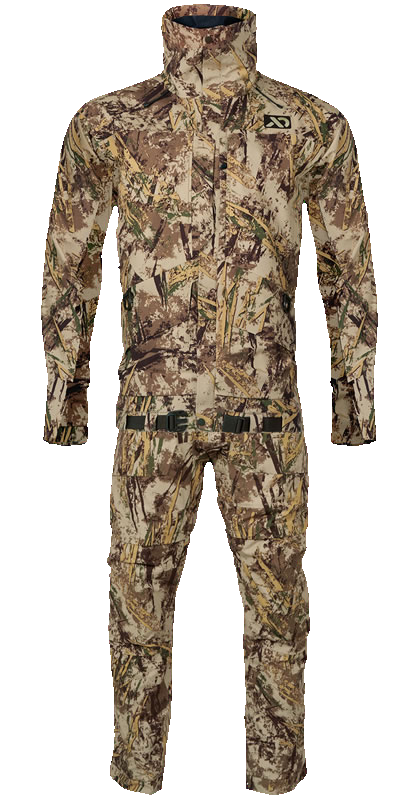
CamoMatrix Pattern DNA
Firstlite
Typha
This pattern stands out most for more fragmented, typical elongation; evenly distributed; and brown / Tan, high saturation, strongly warm.
The dominant detected color families are Brown / Tan. Its average color saturation is high compared with the 247-pattern reference set.
What you may notice:
The pattern carries stronger color intensity than most reference patterns.
24.2% of the sampled pattern falls in the governed dark tonal range. Its tonal-group separation is within the broad middle of the reference set.
What you may notice:
The pattern reads bright at a glance.
Edge density is high, average detected edge strength is typical, and the share of qualifying edges classified as hard is typical relative to the reference set.
What you may notice:
Boundary strength is broadly typical of the reference set.
Fine texture density is high, roughness is high, and texture uniformity is typical compared with the reference set.
What you may notice:
Texture variation across the pattern is broadly typical of the reference set.
Effective retained-region fragmentation is very high, while average retained-region elongation is typical relative to the reference set.
What you may notice:
The visible structure is divided among more effective regions rather than being concentrated into fewer dominant regions.
The analyzer classifies dominant scale as micro. Fine-scale energy is high, mid-scale energy is typical, and large-scale energy is low relative to the reference set.
What you may notice:
Small-scale visual structure makes the strongest contribution to the pattern.
Spatial information balance is very high, while left-right, top-bottom, and rotational asymmetry are very low, typical, and typical relative to the reference set.
What you may notice:
Visual activity is spread relatively evenly across the sampled pattern.
