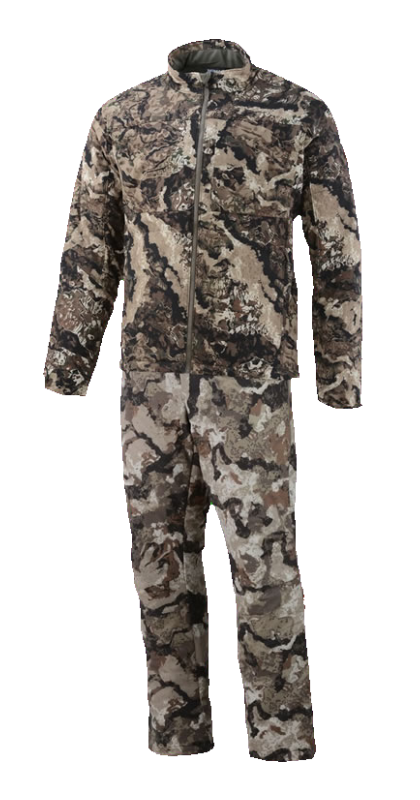
CamoMatrix Pattern DNA
Veil Camo
Whitetail
This pattern stands out most for gray, subdued saturation; typical texture character; and more fragmented, typical elongation.
The dominant detected color families are Gray. Its average color saturation is low compared with the 247-pattern reference set.
What you may notice:
The pattern tends to read as muted or low-color rather than strongly colorful.
41.8% of the sampled pattern falls in the governed dark tonal range. Its tonal-group separation is within the broad middle of the reference set.
What you may notice:
The pattern does not sit near either brightness extreme of the reference set.
Edge density is typical, average detected edge strength is typical, and the share of qualifying edges classified as hard is typical relative to the reference set.
What you may notice:
Boundary strength is broadly typical of the reference set.
Fine texture density is low, roughness is typical, and texture uniformity is typical compared with the reference set.
What you may notice:
Texture variation across the pattern is broadly typical of the reference set.
Effective retained-region fragmentation is high, while average retained-region elongation is typical relative to the reference set.
What you may notice:
The visible structure is divided among more effective regions rather than being concentrated into fewer dominant regions.
The analyzer classifies dominant scale as balanced. Fine-scale energy is low, mid-scale energy is typical, and large-scale energy is typical relative to the reference set.
What you may notice:
No single scale band dominates strongly enough to define the pattern by itself.
Spatial information balance is typical, while left-right, top-bottom, and rotational asymmetry are typical, typical, and typical relative to the reference set.
What you may notice:
The spread of visual activity is broadly typical of the reference set.
